使用 Prometheus 监控 K8s 中的应用程序
环境
kubernetes
helm: 3
kube-prometheus-stack: 集成 Grafana 并且符合k8s的 prometheus 堆
spring boot: 2.5.5
java: 11
helm 安装 kube-prometheus-stack
helm repo add prometheus-community https://prometheus-community.github.io/helm-charts
helm repo update
# 安装在monitoring空间下 记得改 [RELEASE_NAME]
helm install [RELEASE_NAME] -n monitoring prometheus-community/kube-prometheus-stack
包含组件
| 序号 | 组件 | 介绍 |
|---|---|---|
| 1 | Prometheus Operator | Prometheus Operator 提供Kubernetes原生部署和管理 Prometheus及相关监控组件。该项目的目的是简化和自动化基于 Prometheus 的 Kubernetes 集群监控堆栈的配置。 |
| 2 | 高可用的 Prometheus | 时序数据 |
| 3 | 高可用的 Alertmanager | 报警服务 |
| 3 | Prometheus node-exporter | 负责收集集群主机关键指标 |
| 3 | Prometheus Adapter for Kubernetes Metrics APIs | Kubernetes 资源指标、 自定义指标和 外部指标API 的实现(适用于 k8s 发现注册 Prometheus 的关键实现) |
| 3 | kube-state-metrics | 监听 Kubernetes API 服务器并生成关于对象状态的指标 |
| 3 | Grafana | 一款开源数据可视化面板(监控和数据统计) |
访问我们刚部署的服务
kubectl port-forward -n monitoring service/prometheus-kube-prometheus-prometheus 9090
kubectl port-forward -n monitoring service/prometheus-grafana 8080:80
我们访问 Prometheus UI 和 Grafana UI。分别访问http://localhost:9090、http://locahost:8080。grafana 的凭据是username: admin& password: prom-operator。我们也可以从 k8s secrets 中获取密码或者安装时指定 helm的values变量来自定义密码。
添加符合 prometheus 格式输出的指标(以 Java Spring Boot2 应用示例)
dependencies {
	implementation 'org.springframework.boot:spring-boot-starter-actuator'
	implementation 'org.springframework.boot:spring-boot-starter-web'

	implementation 'io.micrometer:micrometer-registry-prometheus'
}
management:
  endpoints:
    web:
      exposure:
        include: '*'
  metrics:
    tags:
      application: ${spring.application.name}
    enable:
      all: true
此时访问应用/actuator/metrics地址时我们会看到 prometheus 格式的指标代表配置成功,格式如下:
<metric name>{<label name>=<label value>, ...} <metric_value>
部署应用
以下配置文件为简化版本,生产环境肯定不止如此,请大家根据自己的服务微调
apiVersion: apps/v1
kind: Deployment
metadata:
  name: spring-boot-monitor-demo-v1
  namespace: prod
  labels:
    app: spring-boot-monitor-demo
    version: v1
spec:
  selector:
    matchLabels:
      app: spring-boot-monitor-demo
      version: v1
  replicas: 2
  template:
    metadata:
      labels:
        app: spring-boot-monitor-demo
        version: v1
    spec:
      containers:
        - name: spring-boot-monitor-demo
          image: demo/spring-boot-monitor-demo:v1.0
          imagePullPolicy: IfNotPresent
          ports:
            - name: http
              containerPort: 8080
apiVersion: v1
kind: Service
metadata:
  name: spring-boot-monitor-demo
  namespace: prod
  labels:
    app: spring-boot-monitor-demo
    service: spring-boot-monitor-demo
    monitor: prometheus # 关键~~~
spec:
  selector:
    app: spring-boot-monitor-demo
  ports:
    - protocol: TCP
      port: 8080
      targetPort: 8080
      name: http
收集指标
此处为核心部分,来告诉 prometheus 捕捉我们应用程序 /actuator/prometheus 的关键指标
prometheus 堆栈的 helm 安装创建了一些 CRD。其中之一是服务监视器(上面介绍到的Prometheus Adapter for Kubernetes Metrics APIs)。服务监视器是我们声明从哪个服务抓取指标和间隔的地方。与其他 k8s 资源一样,它也适用于匹配标签。 一件重要的事情是监控命名空间中的 prometheus 对象在我们拥有标签之前不会知道这个服务监视器 release: prometheus。如果我们描述prometheus resource。kubectl describe prometheuses.monitoring.coreos.com -n monitoring我们会发现它与此标签上的服务监视器相匹配。
  Service Monitor Selector:
    Match Labels:
      Release:  prometheus
在monitoring命名空间中创建以下服务监控器。
# spring boot 标准通用监控
apiVersion: monitoring.coreos.com/v1
kind: ServiceMonitor
metadata:
  name: spring-boot-common
  namespace: monitoring # namespace固定,不要修改
  labels:
    release: prometheus
spec:
  endpoints:
    - interval: 30s
      port: http
      path: /actuator/prometheus  # 填写Prometheus Exporter对应的Path的值,不填默认/metrics
  namespaceSelector:  # 选择要监控service所在的namespace
    matchNames:
      - prod
  selector: # 填写要监控service的Label值,以定位目标service
    matchLabels:
      monitor: prometheus
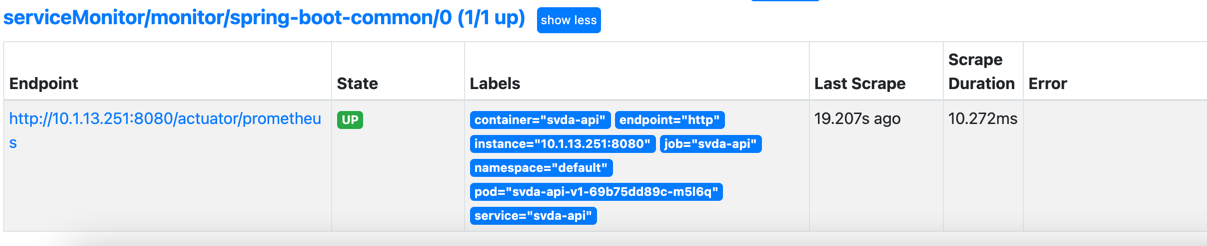
在prometheus控制台服务发现中,我们应该可以看到我们的目标服务spring-boot-monitor-demo(如果Deployment中配置多个实例同样会有多行信息展示)
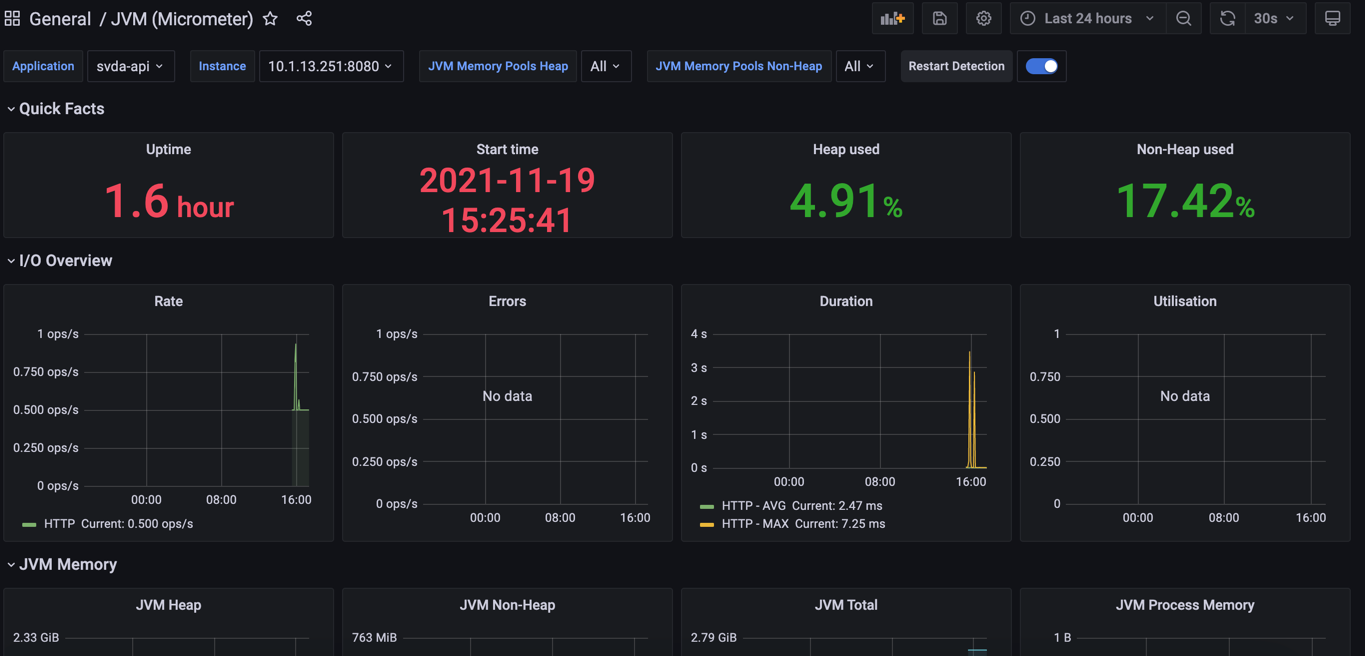
Grafana
在Grafana UI中��添加 Dashboards 模板ID为 4701 查看我们的成果。
附录
Prometheus Push Gateway with Micrometer
除本文方法之外还有另一种方法可以把关键指标推送给Prometheus,不过不建议 原因参考